My previous post gave an overview of the graph visualisation techniques I've been using recently. Here's a more in-depth look at a program watermarked with the dynamic graph watermarking algorithm (as implemented in Sandmark). Is it stealthy? The short answer is 'no'. Here's why...
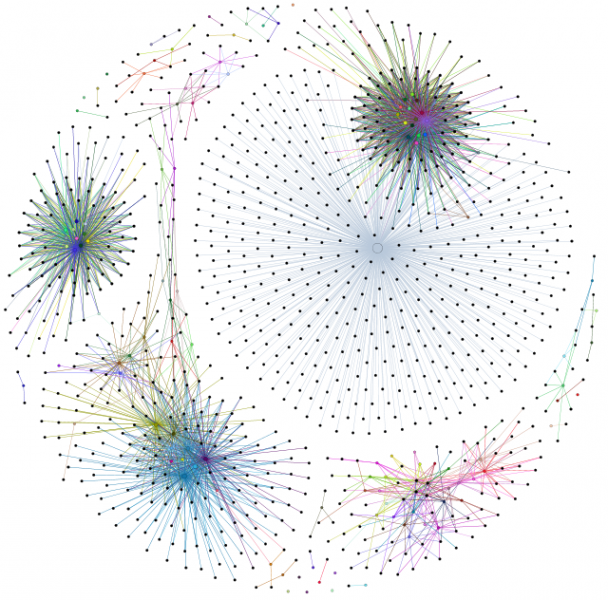
Take a look again at the maximal slice graph of the original and watermarked programs:
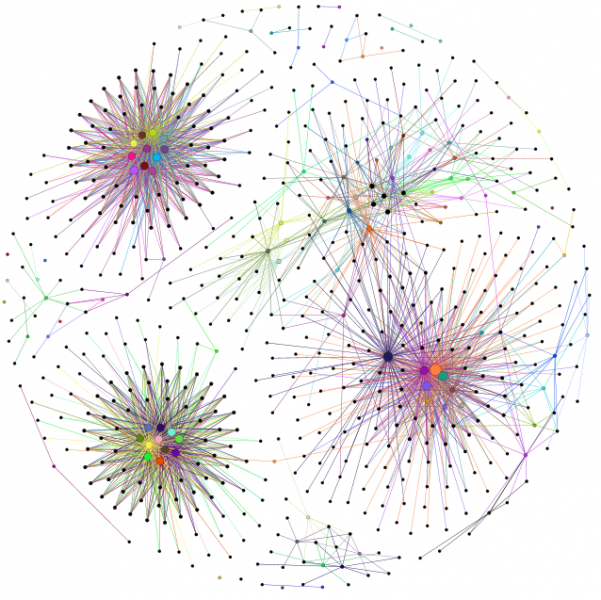
The first graph depicts the TTT test jar containing a Swing application, a command-line application and an applet - this explains the three large clusters. The command-line application uses several classes which explains why one set of slices isn't as tightly clustered as the other two large clusters. The second graph depicts the same TTT test jar watermarked with the dynamic graph watermarking algorithm using Sandmark. In this 2nd graph the watermark maximal slice (let's call it SLwm) clearly stands out. But why?
There are two attributes of SLwm which are different from other maximal slices in the program jar. The first is the size of the maximal slice: this maximal slice contains 430 program statements whereas the average for the unwatermarked program is just 19. The second is the average in-degree - SLwm has an average in-degree of 2. The average in-degree of the neighbouring maximal slices is higher.
Size is an issue for many watermarking algorithms. The dynamic graph watermarking algorithm builds a graph data structure in memory to encode the watermark which leads to a large maximal slice. Many of the statements in SLwm are only in that slice (some are shared by other maximal slices due to the use of opaque predicates). This means that the in-degree of most of the statements in SLwm is 1 (an edge between a and b means that b is in the slice of a). It would be better if the watermark code could be split up, so that there isn't one large watermark slice.
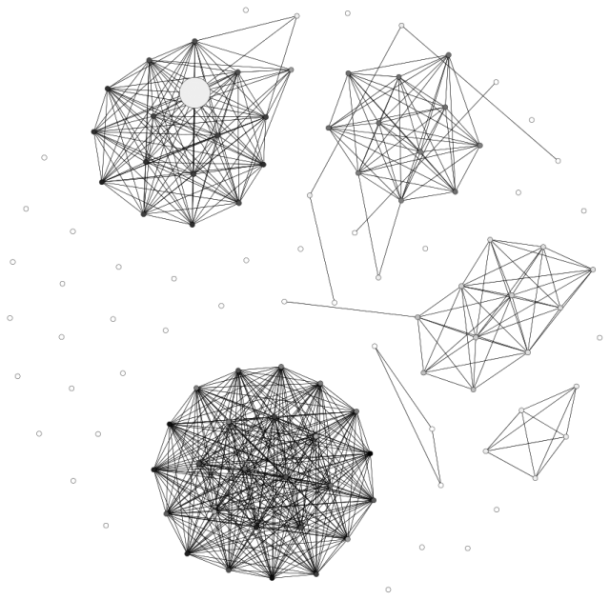
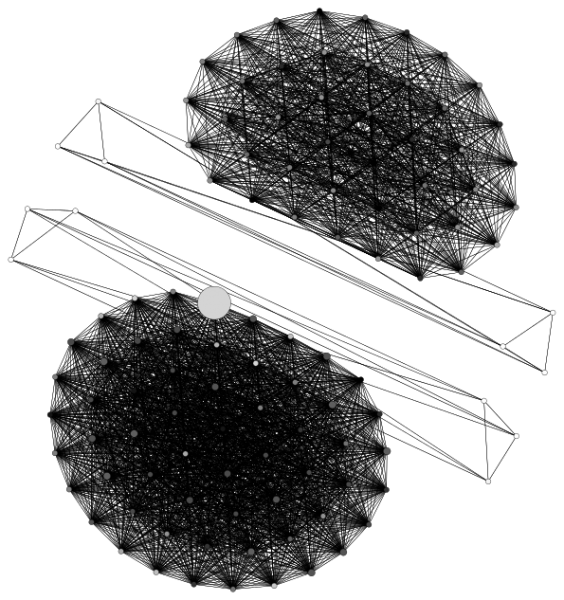
So, watermarks produce large maximal slices where the majority of statements are in that one slice. I've tried to depict this on this graph below, where each node is a maximal slice and two nodes are connected if the maximal slices intersect. The size of the node corresponds to the size of the maximal slice while the colour of the node corresponds to the average in-degree (white is low, black is high).
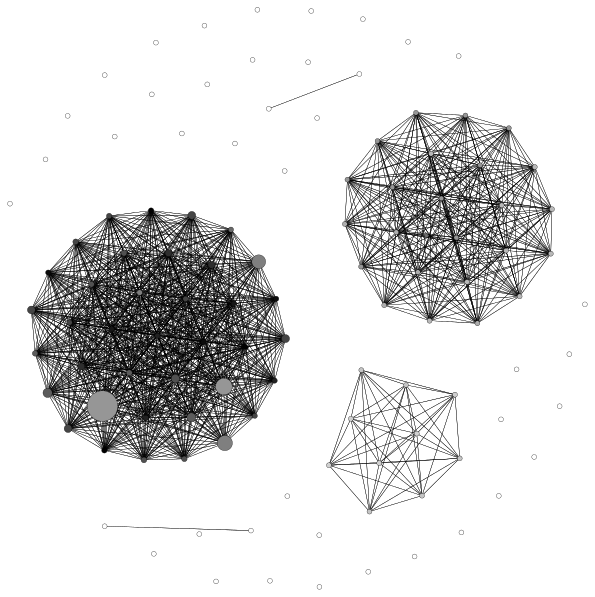
This graph shows the location of the watermark as a large, light-grey node. Although, I have found similar nodes in non-watermarked programs so this may not help us in location watermarks in general. Another interesting thing about these is the shapes produced by the intersecting maximal slices - you can clearly see clusters of maximal slices showing how connected each part of a program is to other parts. The graph layout algorithm1 works very well - vertices connected by an edge are drawn near to each other, but not too close, leading to these nice layouts. Remember that the graph above depicts a jar contain 3 separate programs. Here's a few more simplified maximal slice graphs created from random jars from sourceforge:
- 1. , "Graph drawing by force-directed placement", Software: Practice and Experience, vol. 21, pp. 1129–1164, 1991.